CIS Ice Chart Service
The CIS Ice Charts are used to monitor total ice concentration in the Canadian oceans.
File Provider (EO Team)#
Product Description#
| Service Name | Description | Data Owners | File Type |
|---|---|---|---|
| CIS Ice Chart | Best estimate of total ice conditions at the valid time of the chart | John Bennett | .shp (shapefile) |
Ancilliary Information#
- Product set-up prerequisites:
- AOI
- Time window
- Scihub location
Naming Convention#
cis_Location_YYYYMMDDThhhhh.shplocation- locationYYYY - YearMM - MonthDD – Dayhhhh - hourExample:
cis_SGRDAFOXE_20211101T1800Z_pl_a.shpSymbology Map#
CIS ice Charts display total ice concentration with 5 classes Classes are defined as:
| Label | Color |
|---|---|
| 0 to10% total ice concentration | #8ceaff |
| 10 to30% total ice concentration | #10a32e |
| 30 to 60% total ice concentration | #FDFA00 |
| 60 to 90% total ice concentration | #de821f |
| 90 to 100% total ice concentration | #de251f |
File Uploading Instructions#
- All files should be uploaded to Coresight’s Amazon S3 Bucket:
- Fill out the Coresight Product Onboarding Checklist for new products.
Coresight#
Developers#
- Jeremy Hetzel
- Birva Patel
Processing#
Description#
Data processing takes place using an ingester that imports, converts, creates and stores files.

Ingester Script#
The bulk of the ingestion work on each file is done in the cloud and the script can be found in the ice-chart-ingester repository.
Ingester Functions#
- File receiving: We receive Shapefiles from CIS on our FTP server which is running on AWS everyday.
- Initial Storage: The FTP server copies the files to an S3 bucket. Location of S3 bucket where data is initially stored: AWS S3 Bucket location
- File conversion: File creation on the S3 bucket triggers the ice-chart-ingester. From which Shapefiles provided by CIS is first converted to a GeoJSON file and saved to cloud storage. (AWS S3)
- The GeoJSON is then converted to Mapbox Vector Tiles and saved to cloud storage. (AWS s3 to GCP): GCP Bucket location
- STAC catalog: Ice-chart-ingester catalogs the metadata as a STAC item and converts the shapefile data to geojson and vector tiles. This is the repository used to create the STAC items in that collection: https://github.com/c-core-labs/ice-chart-ingester
- Final Storage: Each ingested ice chart product is in the cis-ice-charts collection in Firestore: Firestore location
- CIS Ice Chart front end: https://github.com/c-core-labs/polar-view-web
Service Interface#
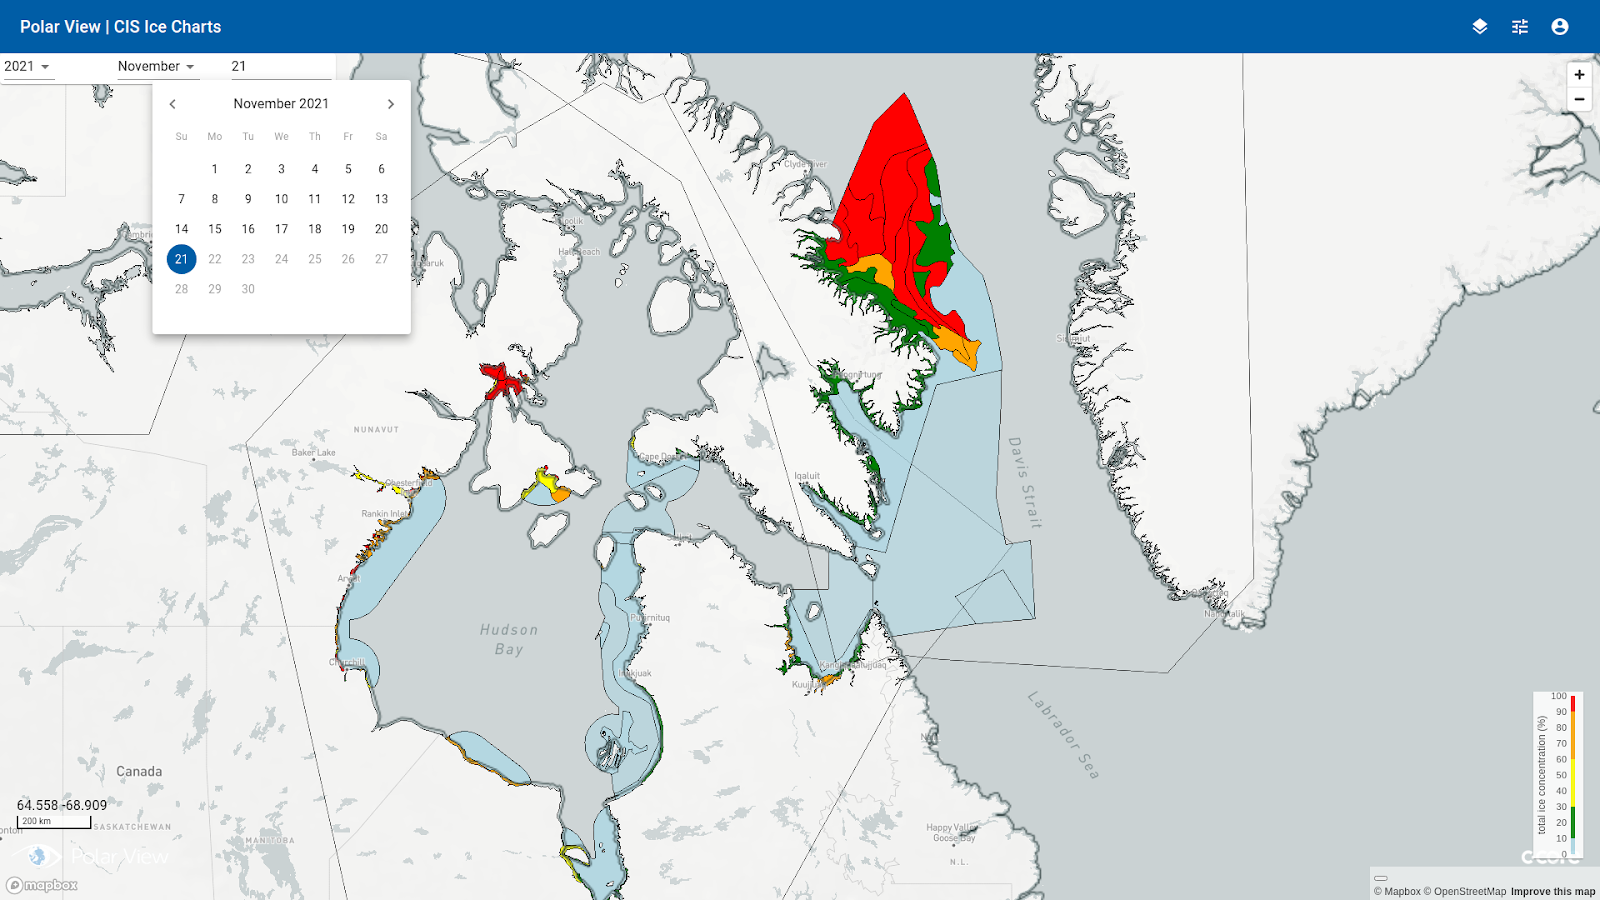
Floeedge displays the most recent CIS Ice Chart
Development#
For ingestion of CIS Ice Chart products, an FTP server was deployed to a virtual machine hosted on a cloud computing platform. The FTP server was configured to save incoming files to a cloud storage bucket. The CIS was provided crednetials for writing data to the FTP server. This allows the CIS to automatically push new CIS Ice Chart data to cloud storage. The cloud storage bucket is s3://c-core-ftp and is viewable via a web console. The FTP server runs on a virtual machine viewable via a web console.
Upon writing a new CIS Ice Chart product to cloud storage, a publish-subscribe message (Eugster et al. 2003) containing the URI of the product is emitted. This message triggers the deployment of an Ice Chart Ingester instance on Google Cloud Platform’s Cloud Run container orchestrator (Jawarneh et al. 2019). The container orchestrator is capable of automatically scaling the Ice Chart Ingester up to 1,000 instances, allowing hundreds of CIS Ice Chart products to be ingested in parralel. The container orchestrator automatically scales to zero instances when no requests are sent to the Ice Chart Ingester, reducing cloud compute costs.
The Ice Chart Ingester instance reads the CIS Ice Chart product from cloud storage. The Shapefile provided by CIS is first converted to a GeoJSON file (Gillies et al. n.d.) and saved to cloud storage. The GeoJSON is then converted to Mapbox Vector Tiles and saved to cloud storage. Mapbox Vector Tiles break the CIS Ice Chart data into small vector tiles, allowing complex geometries to render quickly in a web browser. Metadata (e.g. spatial and temporal extent, GeoJSON URI, vector tiles URI) are converted to a SpatioTemporal Asset Catalog (STAC)(Fergason et al. 2021) JSON item and written to Firestore, a realtime database (“Firestore Documentation” n.d.).
Validation#
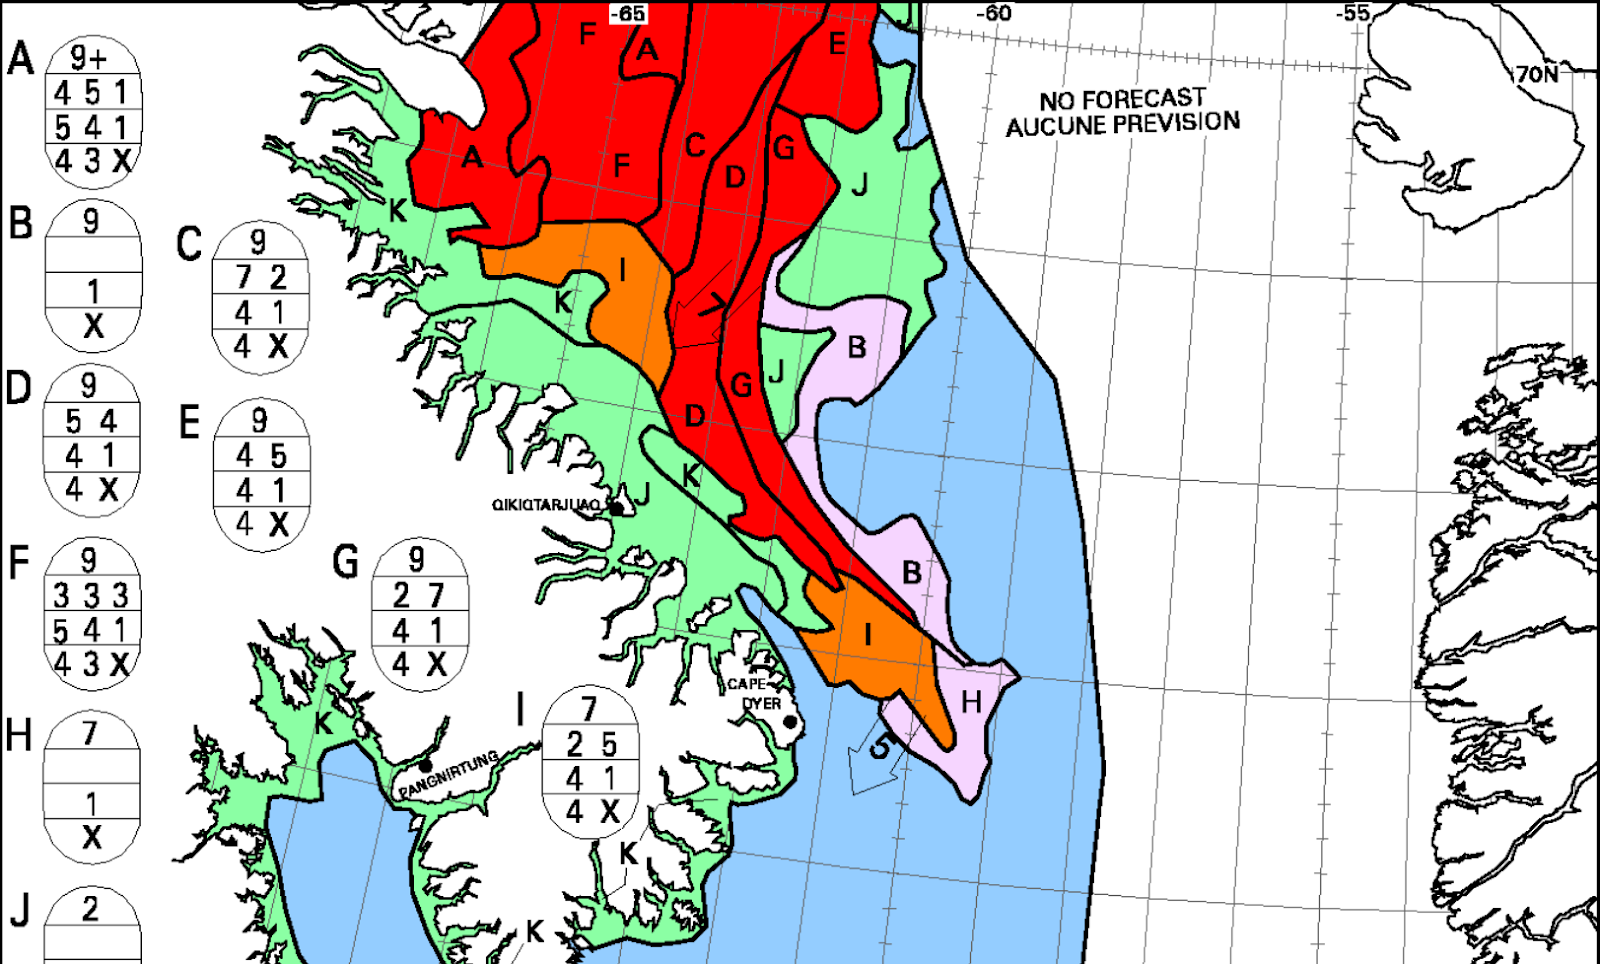
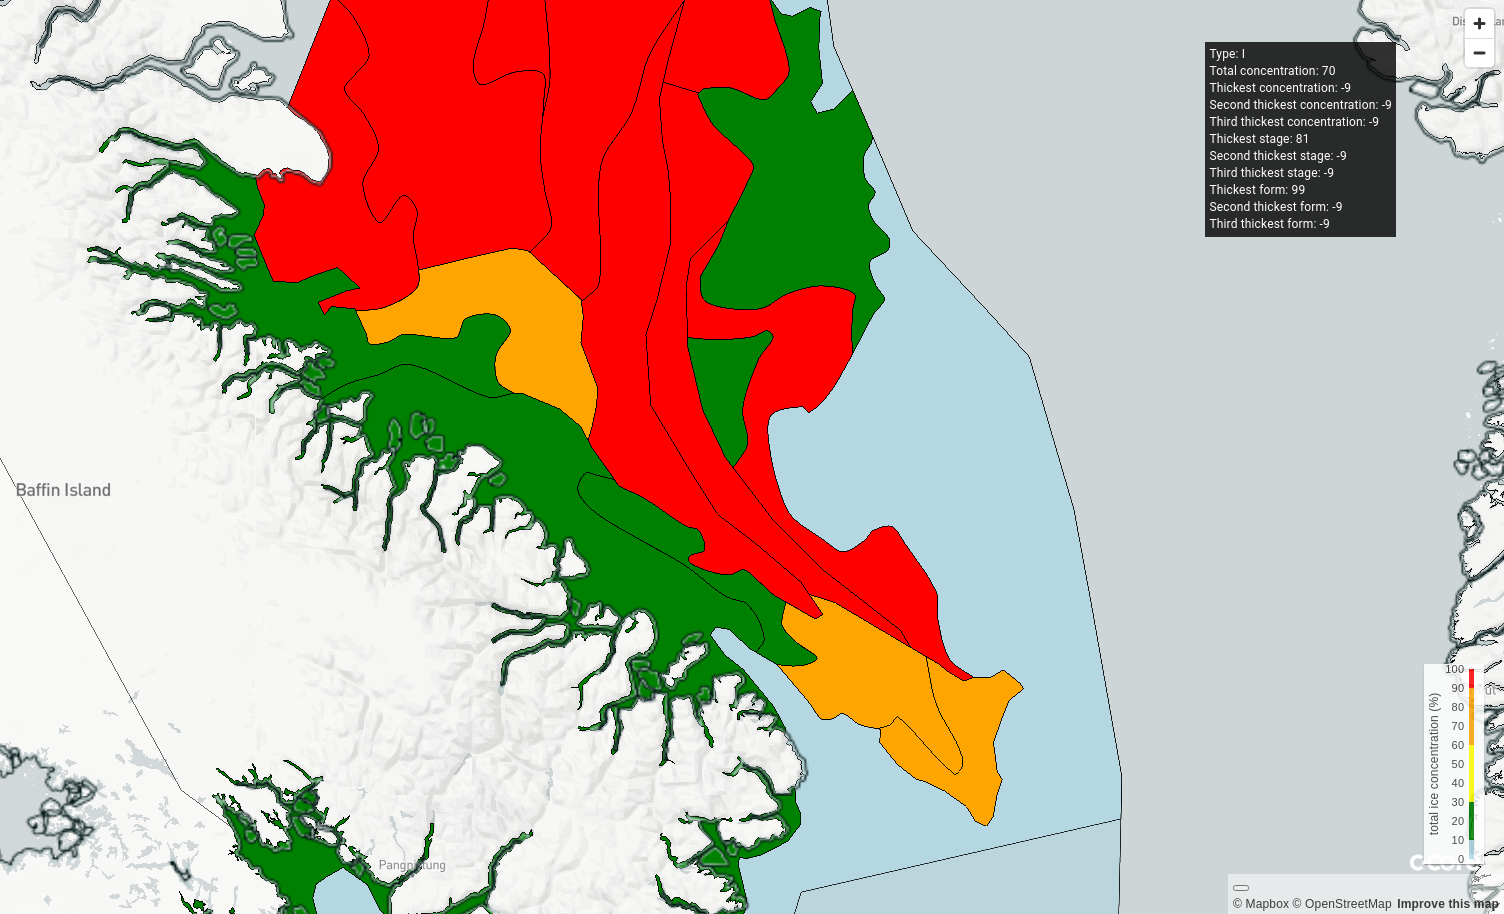
End-to-end validation of the CIS Ice Chart product ingestion was performed by visually comparing ice chart images of the Davis Strait from the CIS web server ( https://iceweb1.cis.ec.gc.ca/ ) to the output Mapbox Vector Tiles. Figures # and # demonstrates a comparison from 2021-11-21.


Results#
DIsplay of the CIS Ice Charts are available via the Polar View web interface at https://floeedge.ccore.ca . The web interface is a single page application (SPA) JavaScript web application. User interface components are implemented with the React user interface component library (“React – A JavaScript Library for Building User Interfaces” n.d.). User interface design follows the Material Design design language (“Material Design” n.d.). The web interface reads metadata from the Firestore database and displays available dates in a calendar date selector component. The web interface filters for all ice chart products matching the selected date and renders those products’ Mapbox Vector Tiles (“Reference | Vector Tiles” n.d.; Netek et al. 2020) on a map. If the user clicks on an ice chart polygon, a popup displays the Egg Code (Canada 2009) data associated with the polygon.
Newly ingested CIS Ice Chart products appear in the web interface in real time without needing to reload the interface. New Ice Chart products are typically available between 20:30 UTC and 22:30 UTC.

Validation demonstrated visually similar ice chart polygons in the web interface compared to ice chart images from the CIS web server ( https://iceweb1.cis.ec.gc.ca/ , see Figures # and #) with a few differences. First, the web interface renders all polygon colors according to the total ice concentration, while the CIS images has additional colours for fast ice, new ice, and gray ice. Future modification will include these additional colour classifications in the web interface. Second, Egg Code data are displayed as textual metadata in a dynamic popup on the web interface. Only a single Egg Data popup is displayed at a time, controlled by the user clicking on a polygon. The CIS image display displays all Egg Data as static Egg Data charts. Future modification will replace the textual metadata popup with a visual Egg Data chart popup.
Future work will make CIS Ice Chart products available to third parties via an Application Programing Interface (API). Polar View and C-CORE currently host a publicly available API to make floe edge polygons available to partners in a human and machine readable interface. The API is an implementation of the OpenAPI version 3 specification [citation] and supports both spatial and temporal search. Reproducible source code examples of interacting with the API via the Python programming language are available in a public notebook ( https://github.com/c-core-labs/notebooks/blob/master/notebooks/c-stac-api.ipynb ). Both floe edge and ice chart metadata are stored in the STAC specification, simplifying work needed to expose the ice chart data to a similar API.