River Ice Classification
SAR satellite images are used to monitor river ice conditions by classifying the ice cover into open water, water and slush on ice surface, non-consolidated ice, and consolidated ice.
File Provider (EO Team)#
Product Description#
Information required from the file provider for product development.
| Service Name | Description | Data Owners | File Type |
|---|---|---|---|
| River Ice | River Ice classification of SAR data | Pradeep, Kelley, Mike | .shp (shapefile) |
Ancilliary Information#
- Product set-up prerequisites:
Naming Convention#
The following naming convention applies to all River Ice Classification files sent to Coresight:
YYYY-MM-DD_RRR_ PPP_SS.jpg
YYYY - Year
MM - Month
DD - Day
RRR - River
PPP – Products (Ice Cover ICOV, Ice Classification CLS, Change Detection CHG)
SS - SensorExample:
2020-03-02_CHU_CLS_R2.shpSymbology Map#
River ice classification is the categorization of backscatter into one of 4 classes during the breakup season vs. 3 classes during the regular season (class 32 removed). Classes are defined as:
| Label | Color | Gridcode Value |
|---|---|---|
| Open water | #004D95 | 31 |
| Wet ice or pooling water on ice | #60C0F3 | 32 |
| Smooth ice | #FDFA00 | 33 |
| Rough ice | #EB3D00 | 34 |
File Uploading Instructions#
- All files should be uploaded to Coresight’s Amazon S3 Bucket:
- Fill out the Coresight Product Onboarding Checklist for new products.
Example Input Image#
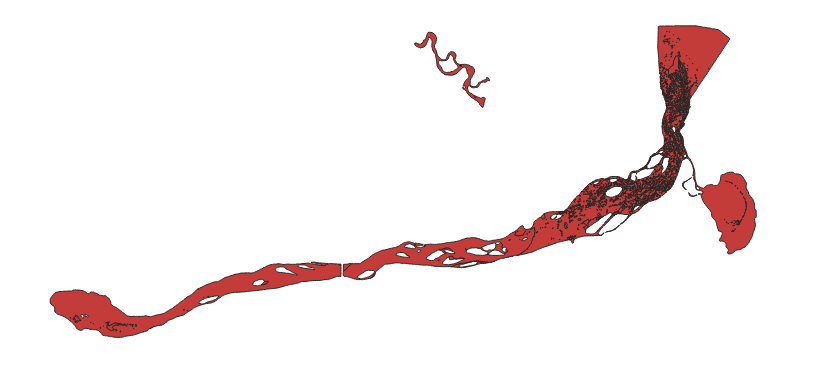
Example shapefile uploaded to Coresight cloud storage.

Coresight#
Developers#
- Jeremy Hetzel
- Chris Boyce.
Processing#
Description#
Data processing takes place using an ingester that imports, converts, creates and stores files.
Ingester Script#
The bulk of the ingestion work on each file is done in the cloud and the script can be found in the river-ice-ingester repository.
Ingester Functions#
- File conversion - shapefile to geoJSON to MapBox Vector Tiles
- File storage - Vector Tiles and geoJSON files on AWS cloud storage
- STAC item creation - Automatic naming based on date, product type and AOI matching.
- STAC catalog:
- Automatic STAC item sorting based on item name.
- Automatic storage in a Firestore collection based on product type and AOI matching.
- Summary statistics - We transform dataframe geometries to a new coordinate reference system and divide them with gridcode(“31,32,33,34”) as an index to get categorized data into 4 sections.
- Notification - emails developers upon product publication.
Real time API Access#
The FastAPI OpenAPI endpoint for the river-ice-ingester can be found here.
Service Interface#
River Ice Web interfaces:
- Retrieves product information through the firestore collection.
- Displays the most recent satellite ice classification analysis.
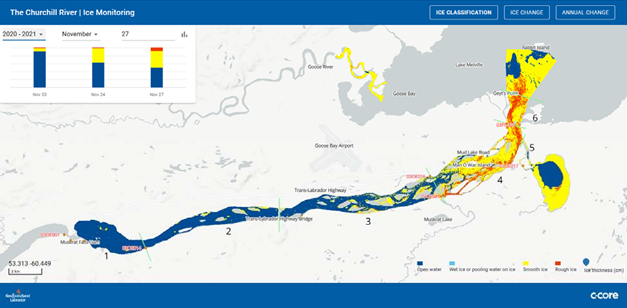
River Ice Classification on the Churchill interface (figure below):
- The upper left graphic displays all of the image analysis dates for a particular ice season.
- The date fields can be used to select seasons, month, and day.
- The upper left graphic also displays ice cover types and area percentages.
- The bottom right area of the map shows the ice classification legend.
- Not all ice types will be displayed with all classification dates.
- Various map elements are included such as river segment numbers, place names, hydrometric and climate data stations, and scale bar.
- The upper right toolbar allows the user to switch between the ice classification and the change detection layers.
