River Ice Thickness
There are two methods of measuring ice thickness:
- Four Sea Ice Mass Balance Arrays (SIMBA) are installed in the ice throughout the winter sending temperature data via satellite.
- Helicopter mounted Ground Penetrating Radar (GPR) measure ice thickness along linear surveys.
File Provider (EO Team)#
Product Description#
Information required for product development.
| Service Name | Description | Data Owners | File Type |
|---|---|---|---|
| River Ice | Ice thickness is measured continuously at four locations and is used as an input to break up forecasting | Pradeep, Kelley, Mike | .csv (spreadsheet) |
Ancilliary Information#
- Product set-up prerequisites:
- AOI
- Locations/places
- Segments and Labels
- SIMBA Stations
Naming Convention#
The following naming convention applies to all River Ice Thickness files sent to WRMD:
Ice_Thickness_RRR_YYYY-MM-DD.csv
YYYY - Year
MM - Month
DD - Day
RRR - River Example:
Ice_Thickness_Chu_2021-04-12Data Uploading Instructions#
- All River Ice Thickness files should be uploaded to Coresight’s Amazon S3 Bucket:
- Fill out the Coresight Product Onboarding Checklist for new products.
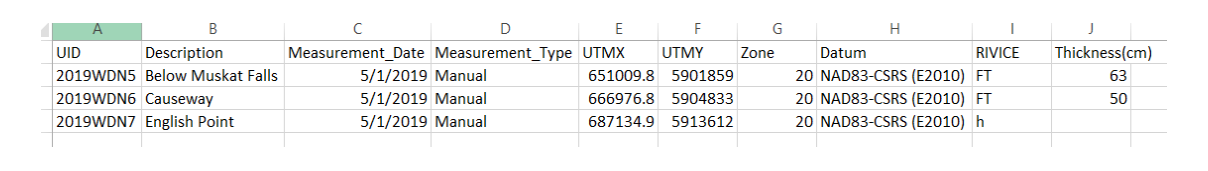
Example Input Image#
Example CSV file uploaded to Coresight cloud storage.
Coresight#
Developers#
- Jeremy Hetzel
- Chris Boyce.
Processing#
Description#
Data processing takes place using an ingester that imports, converts, creates and stores files.
Ingester Script#
The bulk of the ingestion work on each file is done in the cloud and the script can be found in the river-ice-ingester repository.
Ingester Functions#
- File reading - data collection from fields in the CSV files
- STAC item creation - Automatic naming based on date, product type and AOI matching.
- STAC catalog:
- Automatic STAC item sorting based on item name.
- Automatic storage in a Firestore collection based on product type and AOI matching.
- Notification - emails developers upon product publication.
Real time API Access#
The FastAPI OpenAPI endpoint for the river-ice-ingester can be found here.
Service Interface#
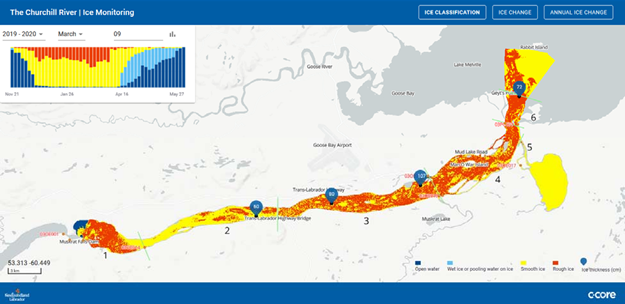
The River Ice Web interfaces retrieve product information through the firestore collection.
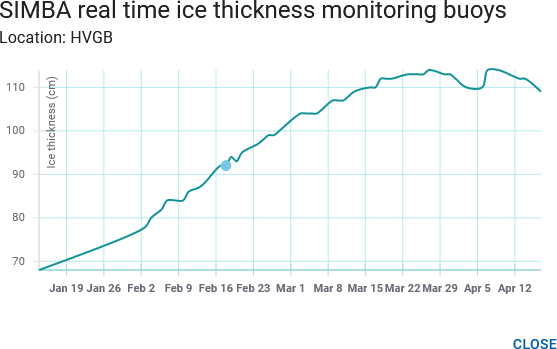
Ice Thickness on the Churchill interface (figure below):
- Beginning with the 2019‐2020 ice season, approximately between mid‐January and the end of April, ice thickness measurements are displayed on the application.
- These data come from four locations on the ice cover where ice thickness is being measured and are identified by the blue markers.
- The numbers within each marker represent the ice thickness measured in centimeters at the time of the ice classification or change.
- Use the left mouse button to display all of the ice thickness data available for a particular ice season.
- Use the mouse to hover over a point on the line and the ice thickness for that time will be displayed.
- These measurements are only available during the season when there is a solid ice cover.
- This information is not available during freeze‐up or break‐up.
- The measurements come from equipment installed on the ice, which measures, records, and transmits temperature data autonomously.
- Ice thickness chart